A Critical Performance Issue Led Me to Discover EchoAPI's Load Testing
In today's software development landscape, the performance and reliability of APIs are crucial. Recently, as a backend developer, I developed a new API endpoint aimed at providing dynamic data query services. The objective was to ensure that the API responded within 100 milliseconds and could handle high concurrency, supporting up to 1000 simultaneous users. Despite initial testing, users reported significant performance issues during peak times. This is a detailed account of how EchoAPI helped identify and resolve these performance bottlenecks.

Initial Requirements and Development Phase
The API endpoint was designed to provide dynamic data query services, with stringent requirements on response time and concurrency:
Response Time: Under 100 milliseconds
Concurrent Users: Up to 1000 users
During initial functional testing, everything appeared to be working fine. However, real-world usage quickly highlighted issues:
- Evening Peak Feedback: Users reported sluggish performance and frequent timeouts in the evening, likely when usage was at its peak.
Discovering the Performance Bottleneck

User Feedback and Initial Troubleshooting
Users experienced significant latency and occasional timeouts during high-load periods, particularly in the evening. To diagnose the issue, I initially drafted a custom concurrency test script. Unfortunately, these tests lacked the complexity and scale of actual traffic, failing to capture the real-world performance issues.
Turning to EchoAPI for Comprehensive Analysis
Recognizing the limitations of my initial testing approach, I turned to EchoAPI for a more robust solution. Here’s how the process unfolded:
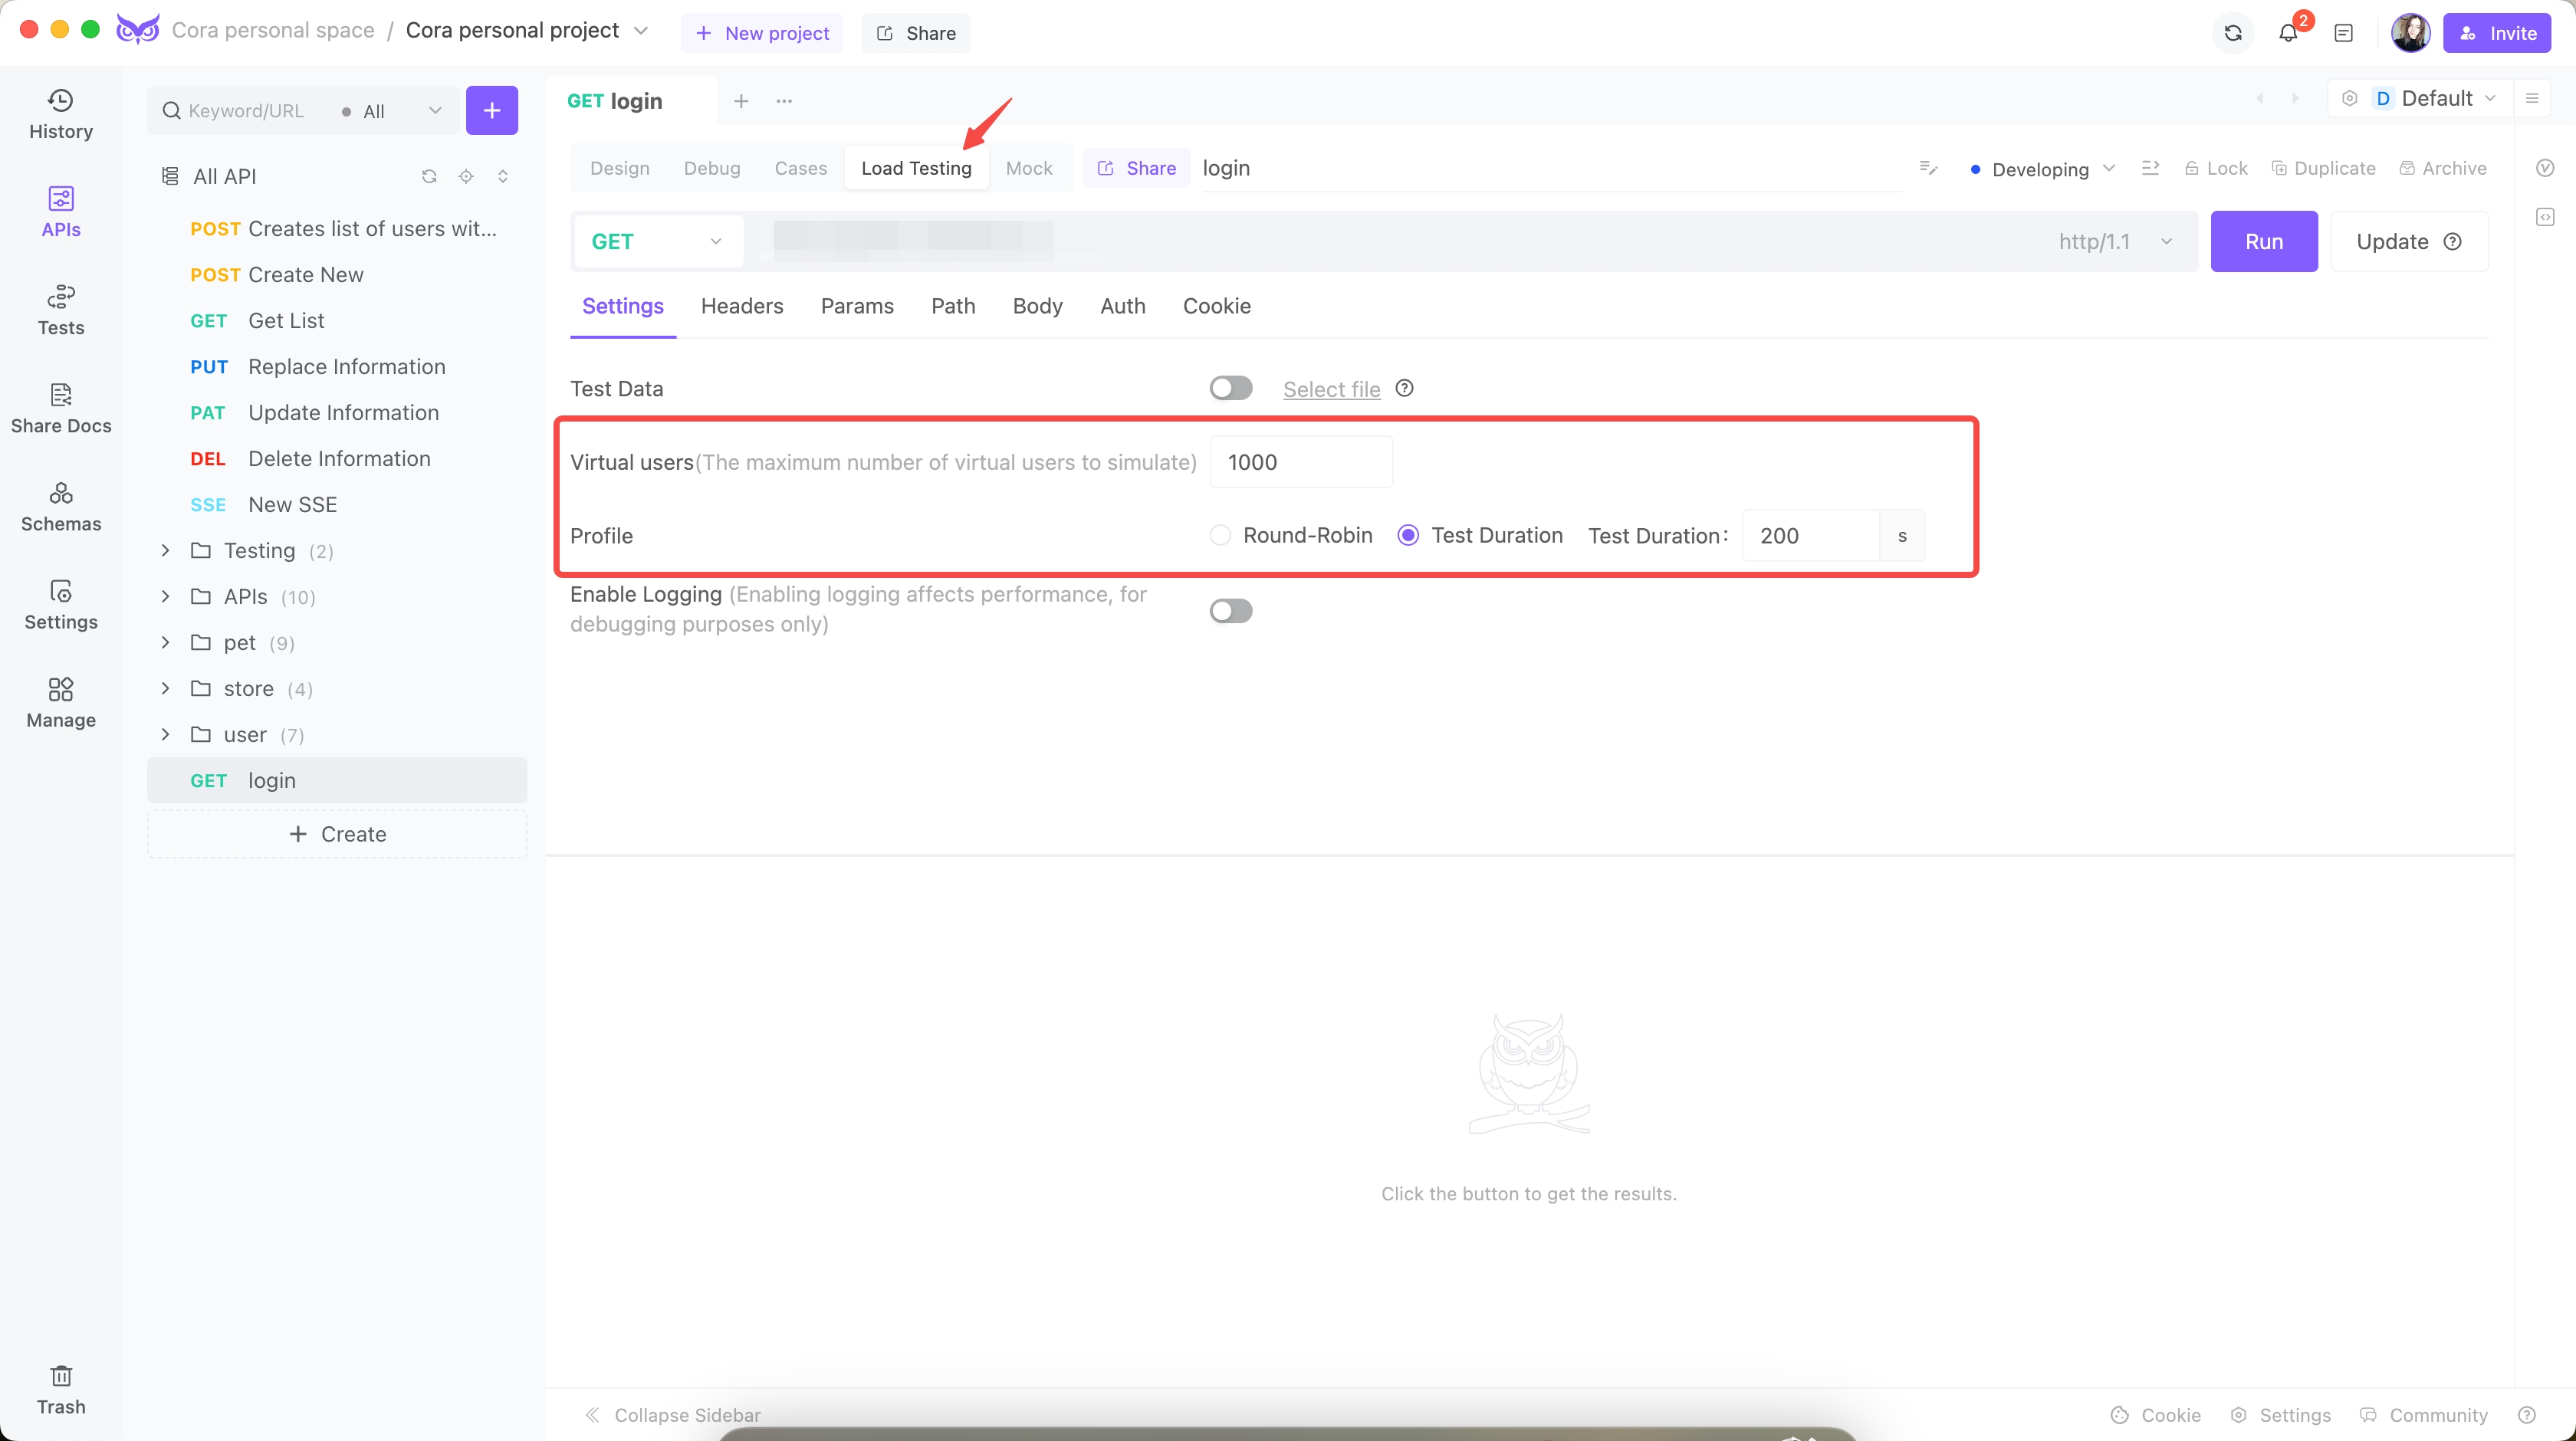
Step 1: Setup and Configuration
I configured EchoAPI to simulate real-world user behavior:
Concurrent Users: 1000
Test Duration: 200

Step 2: Initial Load Tests
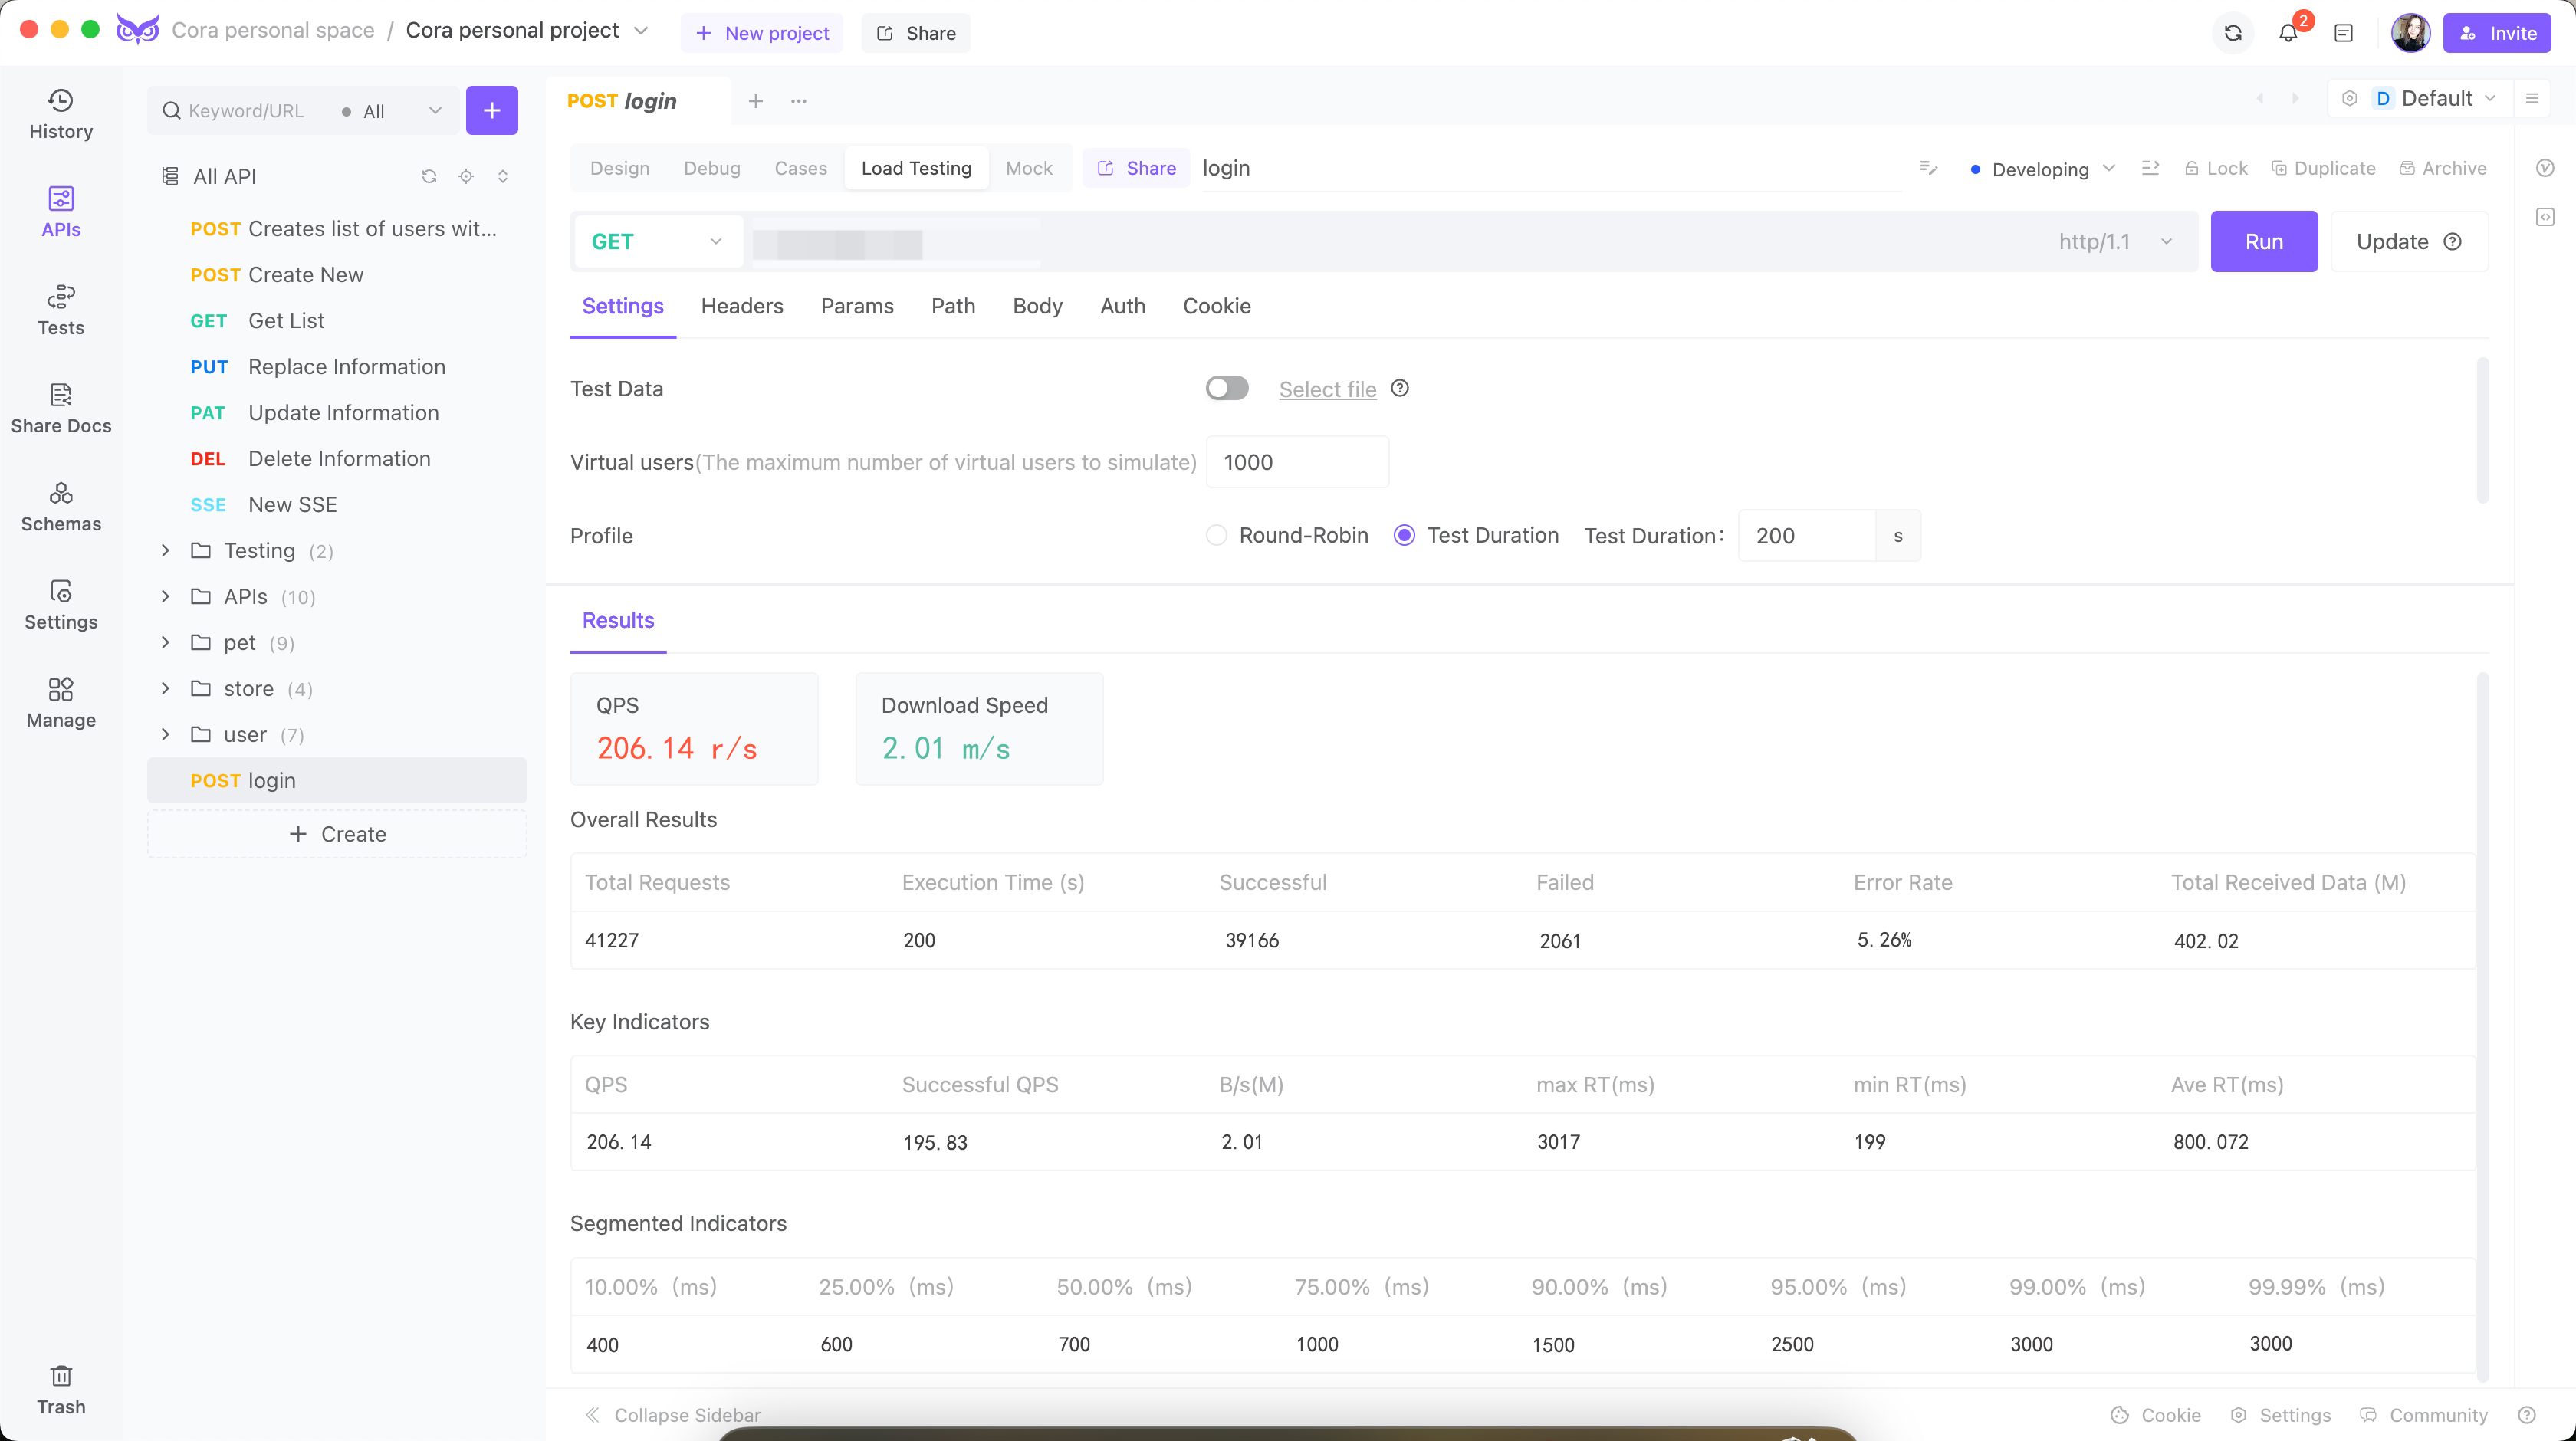
The initial tests revealed startling issues:
Queries-per-second(QPS): 206
Average Response Time (ART): 800 milliseconds
Peak Response Time: 3017 milliseconds
Error Rate: 5.26%
CPU Usage: Spiked to 90%
Memory Usage: Peaked at 85%

These results combined with machine monitoring data clearly indicated several performance bottlenecks:
High Response Times: Average response times were far above the 100 milliseconds target.
Database Query Delays: Significant delays were observed in database query processing.
Resource Utilization: High CPU and memory usage indicated inefficiencies in the API code.
Optimization Strategy and Implementation

Optimization 1: Database Indexing and Query Optimization
Initial analysis showed that database queries were the main bottleneck. Here's what I did:
Before Optimization:
The initial query resulted in full table scans due to the lack of proper indexing:
SELECT * FROM Users WHERE last_login < '2024-01-01';
This query led to slow performance, especially as the dataset grew.
After Optimization:
Adding an index to the last_login column significantly improved query performance:
-- Adding an index
CREATE INDEX idx_last_login ON Users(last_login);

-- Optimized query
SELECT id, name, email FROM Users WHERE last_login < '2024-01-01';
Optimization 2: Code Refinement and Connection Pooling
To further optimize, I refined the API code and implemented connection pooling:
Before Optimization:
The initial implementation involved creating a new database connection for each request and handling responses inefficiently:
# Initial API Code
@app.route('/api/v1/users', methods=['GET'])
def get_users():
    connection = create_db_connection()
    query = "SELECT * FROM Users WHERE last_login > '2024-01-01'"
    users = connection.execute(query).fetchall()
    user_list = [dict(user) for user in users]  # Converting to dictionary
    return jsonify(user_list), 200
Issues Identified:
Database Connection Overhead: Creating a new connection for each request led to excessive overhead.
Inefficient Data Handling: Converting query results to dictionaries was slow.
After Optimization:
To address these issues, I implemented connection pooling and improved data handling:
# Database connection setup with connection pooling
from psycopg2 import pool

db_pool = pool.SimpleConnectionPool(
    1, 20,  # Min and Max connections
    user='dbuser',
    password='dbpass',
    host='localhost',
    port='5432',
    database='exampledb'
)

@app.route('/api/v1/users', methods=['GET'])
def get_users():
    connection = db_pool.getconn()
    try:
        query = "SELECT id, name, email FROM Users WHERE last_login > %s"
        users = connection.execute(query, ('2024-01-01',)).fetchall()
        user_list = [dict(user) for user in users]
    finally:
        db_pool.putconn(connection)  # Return the connection to the pool
    return jsonify(user_list), 200
Improvements:
Connection Pooling: Reduced the overhead by reusing connections.
Efficient Query Execution: Utilized parameterized queries and limited the column selection to only those needed.
These changes reduced API response times by 50% and stabilized CPU usage at around 60%.
Optimization 3: Caching Strategy
Further optimization involved the implementation of a caching mechanism to reduce the load on the database for frequently accessed data:
Implementation Example:
from flask_caching import Cache

# Configure Flask-Caching
cache = Cache(config={'CACHE_TYPE': 'simple'})

@app.route('/api/v1/users', methods=['GET'])
@cache.cached(timeout=300, query_string=True)
def get_users():
    connection = db_pool.getconn()
    try:
        query = "SELECT id, name, email FROM Users WHERE last_login > %s"
        users = connection.execute(query, ('2024-01-01',)).fetchall()
        user_list = [dict(user) for user in users]
    finally:
        db_pool.putconn(connection)
    return jsonify(user_list), 200
Benefits:
Reduced Database Load: By caching the results, repeated requests for the same data resulted in significantly reduced database load.
Improved Response Time: Cached responses were served in milliseconds.
Optimization 4: Load Balancing
To handle increased traffic, I implemented load balancing across multiple server instances:
Nginx Configuration:
# Nginx configuration for load balancing
http {
    upstream api_backend {
        server backend1.example.com;
        server backend2.example.com;
    }

    server {
        listen 80;

        location / {
            proxy_pass http://api_backend;
            proxy_set_header Host $host;
            proxy_set_header X-Real-IP $remote_addr;
            proxy_set_header X-Forwarded-For $proxy_add_x_forwarded_for;
            proxy_set_header X-Forwarded-Proto $scheme;
        }
    }
}
Benefits:
Distributed Load: Requests were distributed evenly across multiple backend servers.
Scalability: Easy to add more servers to the pool to handle increasing traffic.
Re-testing and Validation
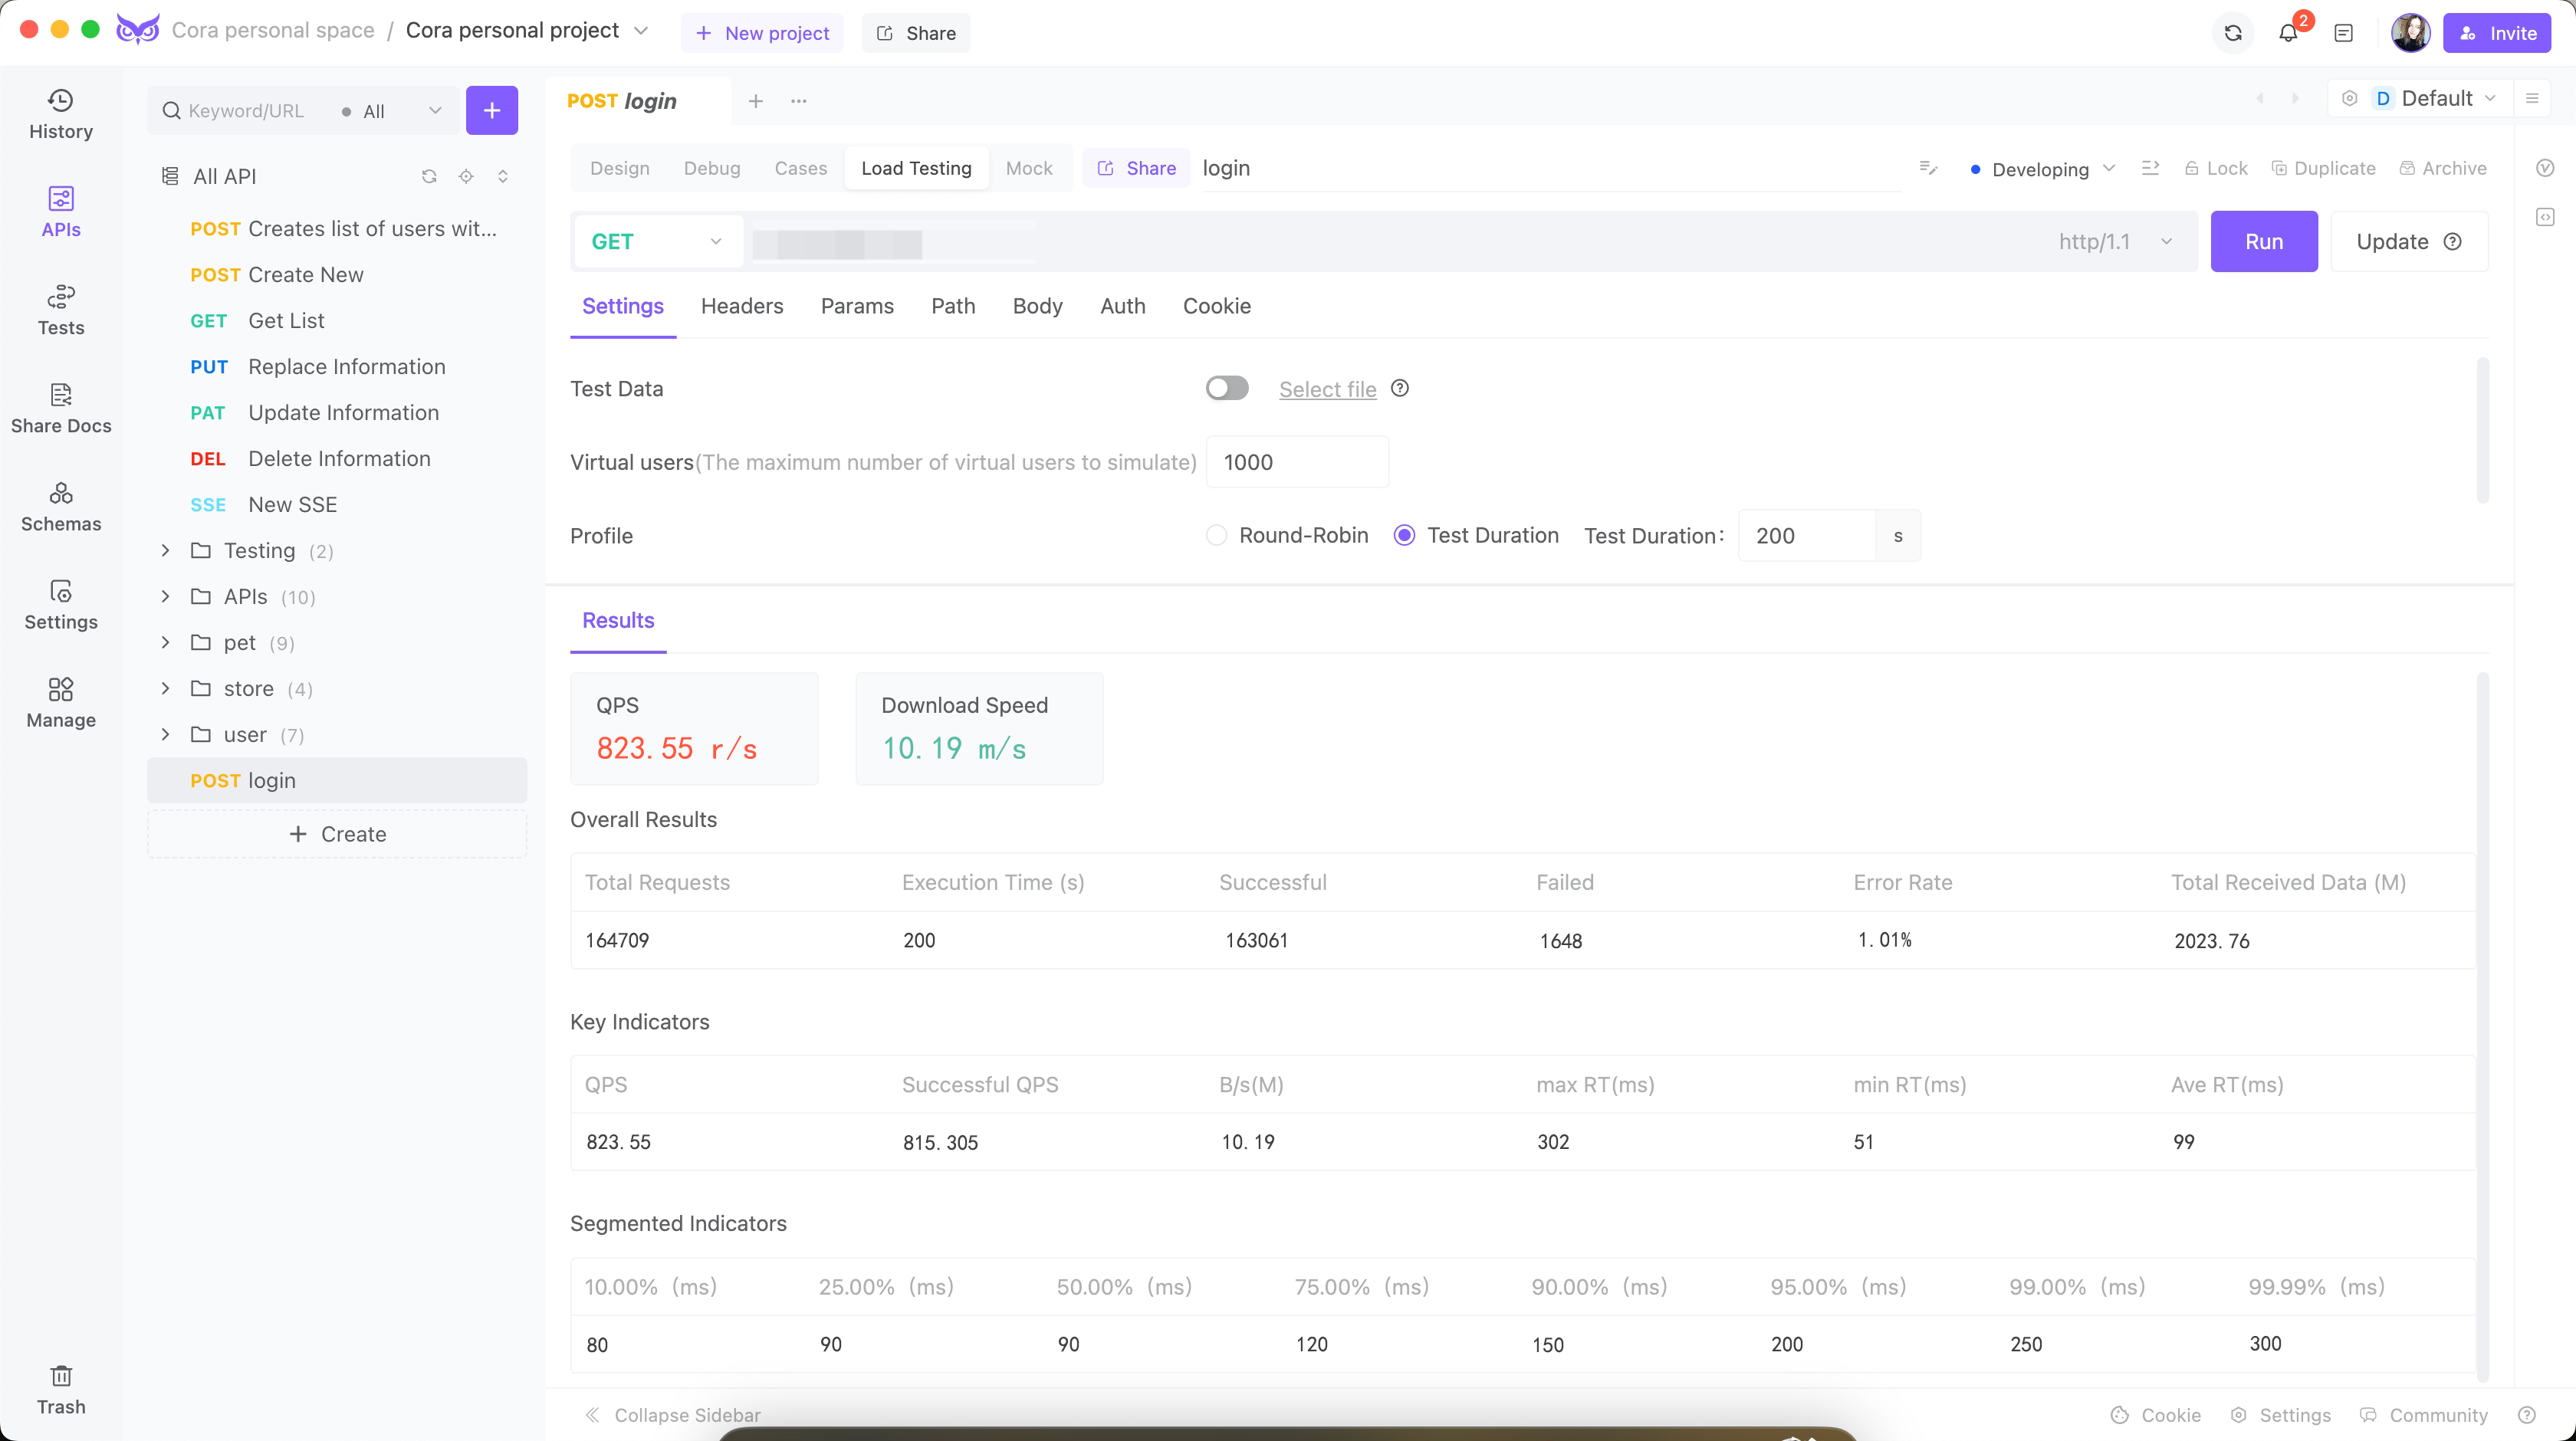
After implementing these optimizations, I conducted another round of load tests using EchoAPI. The results were vastly improved:
Concurrent Users: 1000
Queries-per-second (QPS): 823.55
Average Response Time (ART): 99 milliseconds
Peak Response Time: 302 milliseconds
Error Rate: <1.1%

Key Improvements Achieved:
Reduced Response Times: Average response times decreased from 800 milliseconds to 100 milliseconds, meeting the performance target.
Efficient Resource Utilization: CPU and memory usage stabilized at efficient levels.
Improved Reliability: Error rates dropped significantly, reflecting higher stability and reliability.
Conclusion
Using EchoAPI for load testing was crucial in identifying and resolving significant performance issues in the new API endpoint. The detailed analytics and intuitive interface provided by EchoAPI made it easier to pinpoint specific problems and evaluate the effectiveness of each optimization. This process underscored the importance of comprehensive load testing and the value of using advanced tools like EchoAPI to ensure APIs meet stringent performance and reliability standards.

For any developer looking to optimize their APIs, EchoAPI offers the necessary insights and testing capabilities to achieve significant performance improvements effectively.
Try EchoAPI Interceptor today!